
More Information
Submitted: March 23, 2024 | Approved: August 01, 2024 | Published: August 02, 2024
How to cite this article: Appel F, Ercolin S, Monteiro MM, Lomes N, Uehara S, et al. Reliability and Diagnostic Performance of Transient Hepatic Elastography in Chronic Hepatitis C during the Training Phase. Ann Clin Gastroenterol Hepatol. 2024; 8(1): 021-027. Available from: https://dx.doi.org/10.29328/journal.acgh.1001047.
DOI: 10.29328/journal.acgh.1001047
Copyright License: © 2024 Appel F, et al. This is an open access article distributed under the Creative Commons Attribution License, which permits unrestricted use, distribution, and reproduction in any medium, provided the original work is properly cited.
Keywords: Transient hepatic elastography, Chronic hepatitis C, FibroScan®, Non-invasive fibrosis markers, Operator training, Hepatic fibrosis assessment, Diagnostic performance, Reliability criteria, Clinical applicability, Learning curve

Reliability and Diagnostic Performance of Transient Hepatic Elastography in Chronic Hepatitis C during the Training Phase
Appel F*, Ercolin S, Monteiro MM, Lomes N, Uehara S, Emori CT, Nunes EJS, El Bacha I, Oliveira AC, Feldner ACCA, Silva ISS, Silva AEB, Ferraz MLG, Parise ER and Carvalho-Filho RJ
Senior Scientist at Viecell Institute of Regenerative Medicine, Surat, Gujarat, India
*Address for Correspondence: Appel F, Hepatology Sector, Gastroenterology Discipline, Escola Paulista de Medicina, Universidade Federal de São Paulo, Brazil, Email: flaviaappel@gmail.com
Chronic infection with the hepatitis C virus (HCV) is estimated to affect 58 million people worldwide and around 700,000 individuals in Brazil. Various non-invasive markers of hepatic fibrosis have been proposed, such as transient hepatic elastography (THE) using FibroScan®. However, the reliability of the performance, by operators in the training phase is undetermined, which hinders its applicability in clinical practice.
Objectives: The present study aimed to evaluate the impact of training an inexperienced operator to perform the examinations using FibroScan® in patients with chronic hepatitis C. Specifically, the frequency of unreliable results throughout the training was assessed.
Methods: This is a cross-sectional study with retrospective data collection including compensated chronic hepatitis C patients who underwent the examinations using FibroScan® between March 2014 and December 2016, performed by two researchers. Included patients were divided into two groups based on the operator's experience in the examination: the Experienced Examiner (EE) group and the Examiner in Training (ET) group, with the latter divided into two phases: phase 1, consisting of the first 100 examinations, and phase 2, comprising subsequent examinations. For the reliability analysis, parameters such as success rate (SR), interquartile range (IQR) to median (Md) ratio (IQR/Md), and reliability criteria of Castéra, et al. and Boursier, et al. were used.
Results: Between March 2014 and December 2016, 771 adult HCV-infected individuals were evaluated and divided into EE group (n = 161), ET phase 1 (n = 100), and ET phase 2 (n = 158), showing similar demographic, clinical, and laboratory characteristics. SR and IQR/Md ratios were similar among EE, ET phase 1, and ET phase 2 groups. The proportion of reliable results was comparable in all three groups, using Castéra, et al. reliability criteria (92.5%, 92.0%, and 97.5%, respectively) and Boursier, et al. criteria (96.9%, 95.0%, and 98.1%, respectively).
Conclusion: A short training period (up to 100 examinations) seems to be sufficient for them to have good clinical applicability in the hands of an operator with initial experience in the method.
In individuals with Hepatitis C, the assessment of the degree of hepatic fibrosis is fundamental in the management of chronic infection by the virus, considering that the consequences of advanced fibrosis account for most of the morbidity and mortality related to HCV, such as hepatocellular carcinoma, for example [1,2].
Thus, new non-invasive methods have been used to estimate the degree of hepatic fibrosis, with varying availability and accuracy, but which are comparable in some cases to liver biopsy. These non-invasive fibrosis tests (NIFTs) can be used as a substitute or in association with histological analysis in a large number of liver diseases [3,4], although they have been most frequently evaluated in individuals with chronic hepatitis C [5].
Transient hepatic elastography
Transient hepatic elastography (THE), evaluated by FibroScan®, is a non-invasive physical method that estimates the degree of hepatic fibrosis by measuring hepatic elasticity, which corresponds to the liver tissue's ability to be deformed by an external pressure [6,7]. Hepatic elasticity is estimated from the speed at which a shear wave of moderate amplitude and low frequency propagates through the liver. The propagation speed of this wave is inversely proportional to the elasticity and directly proportional to the stiffness of the liver tissue, referred to in English as liver stiffness, expressed in kilopascals (kPa) (Table 1).
| Table 1:Cut-off points for transient hepatic elastography measured by FibroScan® for estimating the degree of fibrosis in patients with chronic hepatitis C |
||||
| Authors | F0/F1 | F2 | F3 | F4 |
| Castera, et al. (2005) | Até 7.0 kPa | 7.1 kPa | 9.5 kPa | 12.5 kPa |
| Ziol, et al. (2005) | Até 8.7 kPa | 8.8 kPa | 9.6 kPa | 14.6 kPa* |
| *The positive predictive value and the positive likelihood ratio of the cut-off point of 14.6 kPa to estimate the presence of cirrhosis are significantly higher than those observed with the use of the cut-off point of 12.5 kPa." |
||||
Learning curve of EHT
In this study, we chose to analyze one of the widely used non-invasive methods: EHT evaluated by FibroScan®.
However, the reliability of EHT performed by operators in the training phase remains undetermined, complicating the didactic-pedagogical planning in reference centers that perform assistance and teaching activities in Hepatology.
Thus, the question arises about the lack of studies on the learning curve in hepatic elastography. Indeed, in the literature, there is still uncertainty about the ideal number of exams for an operator to become reliable. Therefore, in the present study, we evaluated the learning curve of an operator in training, comparing the reliability of their exams to that observed in exams by an experienced operator, as well as comparing the degree of agreement between the exams of the two operators regarding the APRI index, to estimate the presence or absence of significant hepatic fibrosis.
The strategy for conducting this cross-sectional study began with the retrospective collection of data from patients followed in the outpatient clinics of the Hepatology Sector, linked to the Gastroenterology Discipline of the São Paulo Medical School of the Federal University of São Paulo (EPM-UNIFESP). The primary sources of information were the general medical records of the São Paulo Hospital (HSP), the standardized medical records of the Hepatology Sector, and the computerized system containing results of complementary exams carried out in the HSP-EPM-UNIFESP complex.
Patient selection
All patients with compensated chronic hepatitis C, evaluated in the outpatient clinics of the Hepatology Sector of EPM-UNIFESP, who had undergone EHT exams by FibroScan® (Model: 502 Class IIa) between March 2014 and December 2016 (Figure 1), performed in the same sector by the two researchers responsible for this study (F.A. and R.J.C.F.) were considered eligible for inclusion in this study. At the time of the exams, the M probe was properly calibrated.
Patients who failed to undergo EHT successfully, i.e., those in whom it was not possible to obtain at least 10 valid acquisitions, were excluded. For the diagnostic accuracy analysis of EHT, patients who met one or more of the following criteria were also excluded:
- Antiviral therapy performed in the interval between laboratory tests and EHT;
- Aspartate aminotransferase (AST) levels not available or with results more than 6 months before EHT; and
- Platelet count not available or with results more than 6 months before EHT.
Patients with clinical, laboratory, endoscopic, and imaging evidence suggestive of cirrhosis were included, provided they had compensated disease (Class A of the Child-Pugh score; Pugh, et al, 1973)[8].
EHT evaluation
After a minimum fasting period of two hours, the selected patients underwent the EHT examination using FibroScan®, following the protocol established by the manufacturer, as previously described. In each examination, to obtain at least 10 valid acquisitions, a maximum of 20 "shots" were performed. As these are retrospectively collected exams used for outpatient clinical practice, exams with more than 20 acquisitions had already been excluded before data collection.
The patients included in the study were divided into two groups: Trainee Examiner (TE) and Experienced Examiner (EE), described below, to analyze the reliability of the EHT.
EHT reliability analysis:
A.1. TE group: Patients undergoing EHT examinations performed by a Trainee Examiner (F.A.), who had not conducted EHT exams before January 2014;
A.2. EE group: Patients undergoing EHT examinations performed by an Experienced Examiner (R.J.C.F.), who had conducted more than 500 exams before January 2014.
For the EHT reliability analysis, the following parameters were adopted:
- Success Rate (SR): Equivalent to the quotient between the number of valid acquisitions and the total number of "shots" performed – expressed in percentage. The SR of the TE group was compared to the SR of the EE group as a numerical variable and dichotomously, as the proportion of exams with SR greater than 60%.
- Interquartile Range to Median Ratio (IQR/Md): The IQR/Md ratio of the TE group was compared to that of the EE group as a numerical variable and dichotomously, as the proportion of exams with IQR/Md less than 30%.
- Classic Castera Reliability Criteria [6]: The TE group was compared to the EE group regarding the proportion of results classified as “reliable”, characterized by the presence of all the following criteria:
- Minimum of 10 valid acquisitions;
- SR > 60%; and
- IQR/Md < 30%.
- Boursier reliability criteria [9]: Based on the median value of hepatic stiffness and the IQR/Md ratio value, the reliability of elastography results can be classified as:
- Highly reliable results: IQR/Md < 10%;
- Reliable results: IQR/Md between 10% and 30% or IQR/Md > 30% with Md < 7.1 kPa; or
- Unreliable results: IQR/Md > 30% with Md > 7.1 kPa.
For comparative purposes, results classified as “reliable” and “highly reliable” were grouped into a single subgroup.
In addition to the comparisons between the TE and EE groups, all the EHT reliability parameters described above were also used for longitudinal comparisons between two periods within the TE group, according to the number of exams performed:
- Phase 1: Between the 1st and the 100th EHT exam;
- Phase 2: Between the 101st and the last EHT exam conducted within the study.
Statistical analysis
Initially, sociodemographic data were described using the number and percentage of categorical variables. For the description of quantitative variables, mean and standard deviation were used when the data showed a normal distribution; otherwise, median (P50%), first and third quartiles (P25% and P75%, respectively) were used. The normal or non-normal distribution of continuous variables was verified by the analysis of skewness, kurtosis, and the Kolmogorov-Smirnov normality test.
For the comparison of groups of continuous numerical variables, Student's "t" tests or ANOVA were employed when they presented a normal distribution, and the Mann-Whitney test or Kruskal-Wallis test for non-normally distributed variables. For comparison of categorical variables, the Chi-square test or Fisher's exact test was performed when appropriate.
All analyses were conducted using the STATA/SE 15.1 for Windows (StataCorp, USA) and IBM SPSS Statistics for Macintosh, version 20 (Armonk, NY: IBM Corp), adopting a significance level of 5% (α = 0.05); that is, p-values less than 0.05 were considered statistically significant.
Ethical aspects
This study was conducted according to the guidelines established by the World Medical Association in the Declaration of Helsinki, updated in Scotland in 2000, and with Clarification Note in Japan in 2004. Additionally, the study was also conducted according to the good clinical practices of the Americas document, Resolution 347/05 and Resolution 466/12. Before the study, written approval of the protocol was obtained from the Research Ethics Committee of EPM-UNIFESP.
It is important to emphasize that all necessary information for the execution of this study was collected from medical consultation records and complementary exams (including the EHT exam itself), indicated by the Hepatology Sector team, and performed during the routine follow-up of patients.
The researchers involved and the institution where the study was conducted committed to comply with all terms of the Guidelines and Regulatory Norms for Research Involving Human Beings and complementary norms of the National Health Council and the National Health Surveillance Agency, including making the results of this research public, whether they are favorable or not.
Distribution of the Case Series (Tables 2,3).
| Table 2: Description of sociodemographic and clinical variables of patients, according to the operator and phase: | ||||
| Variable/Group | EE (n = 161) |
ET Phase 1 (n = 100) |
ET Phase 2 (n = 158) |
p - value |
| Gender, n (%) | 0.372d | |||
| Female | 101 (62.7) | 60 (60) | 87 (55,1) | |
| Male | 60 (37.3) | 40 (40) | 71 (44,9) | |
| Age, years | ||||
| Mean ± SD, years | 56.3 ± 12.5 | 5.1 ± 12.,0 | 56.1 ± 12.8 | 0.334e |
| Racea, n (%) | 0.476d | |||
| Caucasoides | 74 (61.7) | 39 (54.2) | 85 (55.2) | |
| Non-Caucasians | 46 (38.3) | 33 (45.8) | 69 (44.8) | |
| BMIb, n (%) | 0,115d | |||
| < 30 kg/m2 | 38 (80,9) | 11 (100,0) | 114 (74,5) | |
| ≥ 30 kg/m2 | 9 (19,1) | 0 (0,0) | 39 (25,5) | |
| ETOHc, n (%) | 0,906d | |||
| < 20 g/day | 142 (94,0) | 91 (92,9) | 145 (94,2) | |
| ≥ 20 g/day | 9 (6,0) | 7 (7,1) | 9 (5,8) | |
| EE: Experienced Examiner; ET Phase 1: Trainee Examiner in Phase 1; ET Phase 2: Trainee Examiner in Phase 2; dChi-square test; eStudent's t-test; SD: Standard Deviation; No information in 73 cases (17.4%). BMI: Body Mass Index. bNo information in 208 cases (49.6%). ETOH: Ethanol Consumption; cNo information in 16 cases (3.8%). |
||||
| Table 3: Description of variables related to patient comorbidities, according to the operator and phase. | ||||
| EE (n = 161) |
ET Phase1 (n = 100) |
ET Phase 2 (n = 158) |
p* | |
| DRC-HDa, n (%) | 0.411 | |||
| No | 144 (92.9) | 88 (88.0) | 141 (91.0) | |
| Yes | 11 (7.1) | 12 (12.0) | 14 (9.0) | |
| TxH, n (%) | 0,028 | |||
| No | 156 (9.9) | 100 (100.0) | 158 (100,0) | |
| Yes | 5 (3.1) | 0 (0) | 0 (0.0) | |
| TxRa, n (%) | 0,162 | |||
| No | 136 (87,7) | 88 (88,0) | 145 (93,5) | |
| Yes | 19 (12,3) | 12 (12,0) | 10 (6,5) | |
| HIVb, n (%) | 0,074 | |||
| No | 81 (96,4) | 39 (95,1) | 154 (99,3) | |
| Yes | 3 (3,6) | 2 (4,9) | 1 (0,7) | |
| HASc, n (%) | 0,957 | |||
| No | 79 (50,6) | 51 (51,0) | 81 (52,3) | |
| Yes | 77 (49,4) | 49 (49,0) | 74 (47,7) | |
| DMa, n (%) | 0,453 | |||
| No | 120 (77,4) | 83 (83,0) | 119 (76,8) | |
| Yes | 35 (22,6) | 17 (17,0) | 36 (23,2) | |
| DLPd, n (%) | 0,617 | |||
| No | 142 (92,8) | 87 (90,6) | 139 (89,7) | |
| Yes | 11 (7,2) | 9 (9,4) | 16 (10,3) | |
| EE: Experienced Examiner; ET Phase 1: Trainee Examiner in Phase 1; ET Phase 2: Trainee Examiner in Phase 2; Chi-square test; DRC-HD: Chronic Kidney Disease under Hemodialysis; aNo information in 9 cases (2.1%); TxH: Liver Transplant; TxR: Kidney Transplant; HIV: Human Immunodeficiency Virus; bNo information in 139 cases (33.2%); HAS: Systemic Arterial Hypertension; cNo information in 8 cases (1.9%); DLP: Dyslipidemia; dNo information in 15 cases (3.6%) |
||||
EHT Reliability Analysis (Tables 4,5, Figures 2-5).
| Table 4: Description of variables related to the reliability analysis of transient hepatic elastography exams performed by the Experienced Examiner (EE) and the Trainee Examiner (ET) |
|||
| EE (n = 161) | ET (n = 258) | p | |
| SR, % | |||
| Median (Q1 – Q3) | 100.00 (91–100) | 100,0 (91.0–100) | 0.593a |
| SR > 60%, % | 96.3 | 97.7 | 0.549b |
| IQR/Md, % | |||
| Median (Q1 – Q3) | 16.0 (11.0–22.00) | 16.5 (12.0–21.0) | 0.885a |
| IQR/Md < 30%, % | 95.7 | 96.1 | 0.812c |
| EE: Experienced Examiner; ET: Trainee Examiner; TS: Success Rate; Q1: First Quartile; Q3: Third Quartile; IQR/Md: Ratio between the interquartile range and the median of hepatic stiffness; aMann-Whitney test; bFisher's exact test; cChi-square test |
|||
| Table 5: Description of variables related to the reliability analysis of transient hepatic elastography exams performed by the Trainee Examiner (ET) during Phase 1 and Phase 2. |
|||
| ET Phase 1 (n = 100) |
ET Phase 2 (n = 158) |
p* | |
| SR, % | |||
| Median (Q1 – Q3) | 100.0 (91.0–100.00) | 100.0 (91.0–100.00) | 0.728 |
| SR > 60%, % | 98.00 | 97.50 | 1.00 |
| IQR/Md, % | |||
| Median (Q1 – Q3) | 17,0 (13.0–23.00) | 16.0 (11.00–21.00) | 0.277 |
| IQR/Md < 30%, % | 93.0 | 98.10 | 0.050 |
| EE: Experienced Examiner; ET: Trainee Examiner; SR: Success Rate; Q1: First Quartile, Q3: Third Quartile; IQR/Md: Ratio between the interquartile range and the median of hepatic stiffness; *Mann-Whitney test. | |||
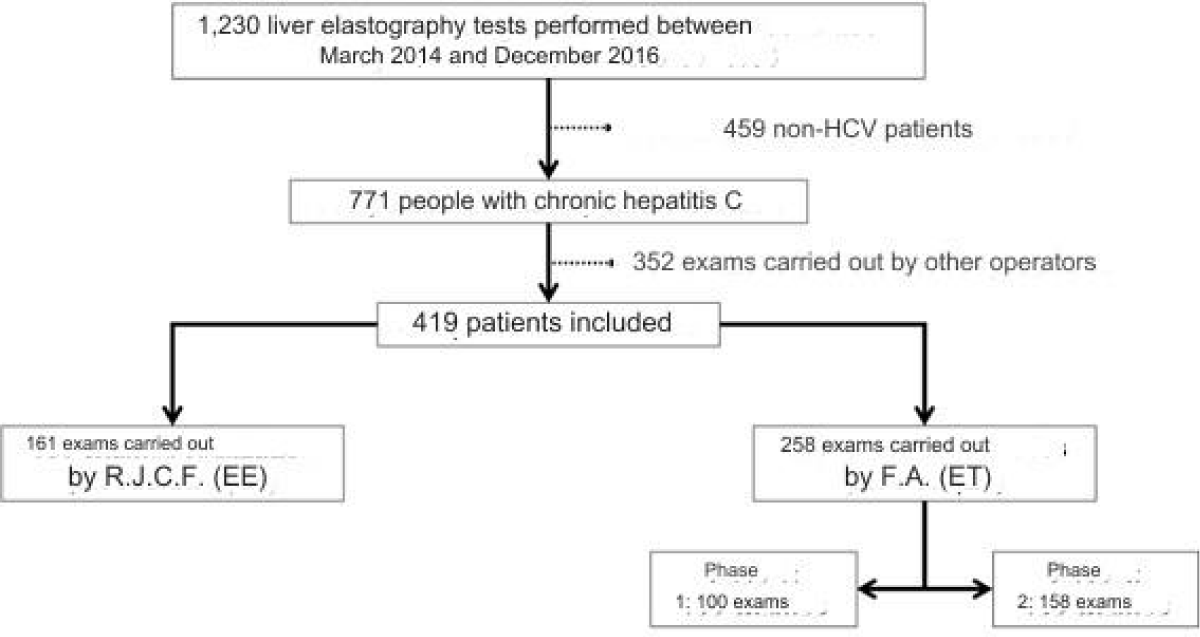
Figure 1: The workflow chart

Figure 2: Reliability classification of transient hepatic elastography for exams performed by the Experienced Examiner (EE, n = 161) and the Trainee Examiner (ET, n = 258), according to the criteria of Castera, et al. (2005). (p = 0.230)
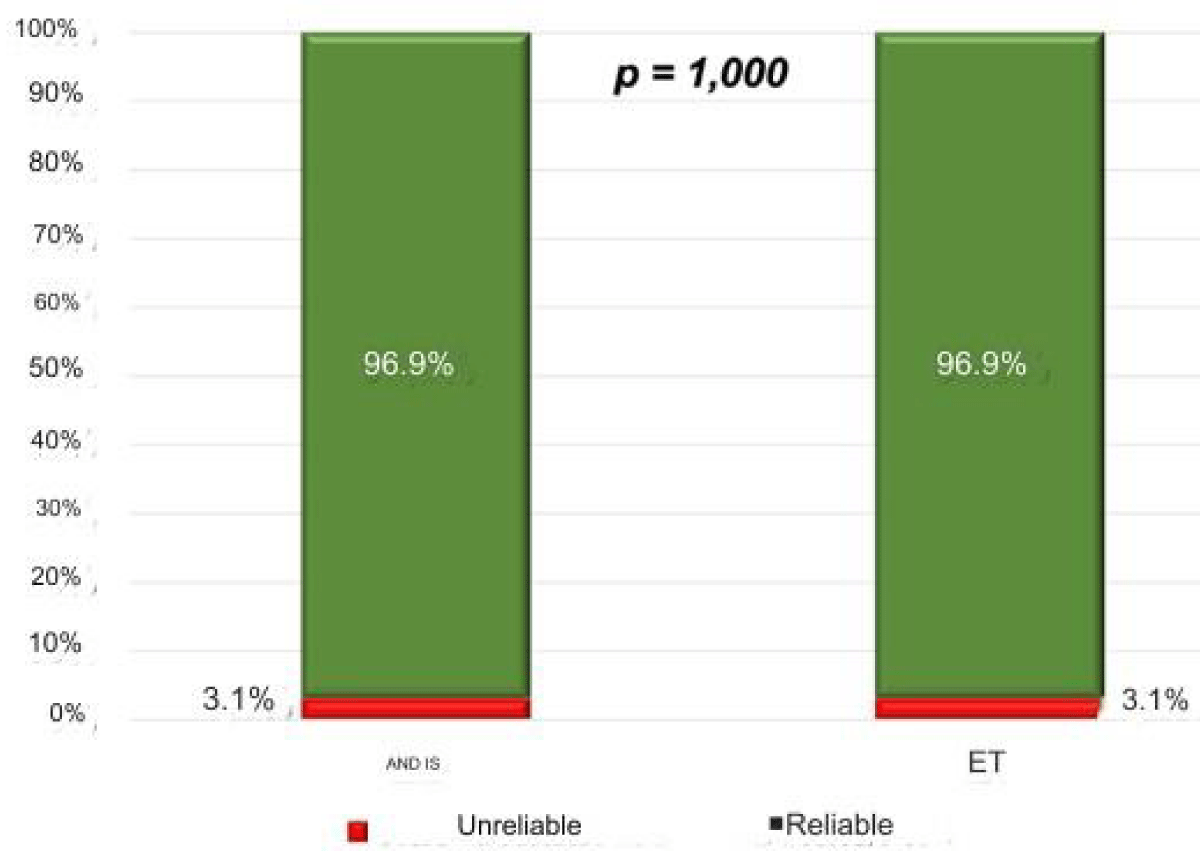
Figure 3: Reliability classification of transient hepatic elastography for exams performed by the Experienced Examiner (EE, n = 161) and the Trainee Examiner (ET, n = 258), according to the criteria of Boursier, et al. (2013).** (p = 1.00).
Figure 4: Reliability classification of transient hepatic elastography for exams performed by ET during Phase 1 (n = 100) and during Phase 2 (n = 158), according to the criteria of Castera, et al. (2005). ** (p = 0.065).
Figure 5: Reliability classification of transient hepatic elastography for exams performed by the Trainee Examiner (EE) during Phase 1 (n = 100) and during Phase 2 (n = 158), according to the criteria of Boursier, et al. (2013). ** (p = 0.267).
Sample characteristics
As previously presented, the initial casuistry of this study consisted of 1,230 adult patients evaluated at the Hepatology Department of EPM-UNIFESP between March 2014 and December 2016. Of these, 771 were chronic hepatitis C carriers, a diagnosis confirmed before EHT. From this group, 161 exams were conducted by the Experienced Examiner (EE) (R.J.C.F.), and 258 were performed by the Trainee Examiner (ET) (F.A.).
The ET exams were divided into two phases: Phase 1 refers to the first 100 exams and Phase 2 to the remaining 158. This division was based on the criteria described by Boursier [10]. In this study, the learning curve and reproducibility of EHT results were evaluated. The number of exams performed by the operator would not be a factor influencing the reproducibility of EHT. However, as the operator gained more experience, there would be an improvement in the accuracy of the conducted exam.
Another study regarding the analysis of the learning curve and reproducibility of EHT was conducted by Perazzo and colleagues (2016) [11]. These researchers compared a trainee operator with an experienced one. Three training phases of the operator were considered, with the cut-off for the first phase being the execution of 100 exams. These authors observed that, from the first phase, it is possible to say that the accuracy of exams performed by the trainee operator would be the same as those done by an experienced operator. Thus, based on these four articles, the cut-off of 100 exams was used as the determinant of experience for the trainee operator.
In contrast, Castera and colleagues (2010) [12] question the 100-exam criterion. In their study, those who met the reliability criteria determined by the manufacturer (success rate greater than 60%, IQR/Md less than 30%, and more than 10 measurements made on the device) were those operators with more than 500 exams performed.
In this study, one of the examiners had exceeded 500 exams performed, being named the experienced examiner, according to Castera's criteria [12]. Thus, it was possible to analyze the trainee examiner's performance based on the experienced examiner's performance.
Given these highlighted discrepancies, the need arose to study the learning curve and determine the ideal cut-off for defining a reliable operator, that is, to generate information for the proper training of examiners. As mentioned earlier, there are few studies on this subject.
EHT reliability analysis
As previously mentioned, the EHT is based on reliability parameters for the examination to be applicable for clinical and scientific activity. One of the most cited studies in the literature on this subject was by Castera [6], published in Gastroenterology. In this study, various indirect markers of hepatic fibrosis were compared, including APRI and FibroScan®. In the article, the EHT measurement was considered valid when 10 measurements were made and the success rate was at least 60%, with no mention of the necessary interquartile range (Figures 2-5) (Tables 1-5).
Subsequently, Fraquelli, et al. (2007) [13] published in Gut about the reproducibility of EHT, an article cited in other studies evaluating the reproducibility of EHT; also adopted, as a parameter associated with the number of measurements, an IQR/Md ratio of less than 30%, and proposed a success rate higher than 65%, which would maximize result reproducibility.
Later, in Lucidarme, et al. (2009) [14], published in Hepatology, the IQR/Md of less than 30% was questioned. The author believes that this reference would cause an "overestimation" of hepatic fibrosis in the EHT result analysis compared to liver biopsy evaluations. Thus, it was proposed that the IQR/Md should be less than 21%, which would increase the exam's accuracy.
Following this, Castera and colleagues, [12], in a prospective study with 13,369 exams of patients with various etiologies, reinforced the reliability criteria that had already been cited in 2005, including the IQR/Md interval of less than 30%. This time, they described them as criteria suggested by the device manufacturer.
Finally, in 2013, Boursier and colleagues [9] questioned the reliability parameters described by Castera [6], based on a 15% loss of exams (considered unreliable), even though such criteria had not been adequately validated, and their impact on the method's accuracy had not been evaluated. Thus, the researcher proposed new reliability criteria: very reliable exams, those with an IQR/Md of 10% or less; reliable exams, which present any stiffness measurement and IQR/Md between 10% and 30% or stiffness less than 7.1 kPa and IQR/Md greater than 30%; and unreliable exams, with hepatic stiffness equal to or greater than 7.1 kPa and IQR/Md greater than 30%. Most of the study's exams fell into the reliable exams category, and through this analysis, there was a loss of only 9% of exams considered unreliable. Additionally, this study also demonstrated that, for an EHT exam to be reliable, there was no need to analyze the number of valid measurements associated with the success rate and IQR/Md, as they were not relevant to the method's accuracy.
Our study, designed in 2014, shortly after the publication of Boursier's study and colleagues (2013) [2], adopted the need to obtain at least 10 valid measurements, a requirement provided in Castera's reliability criteria [6]. However, it is worth noting that, currently, in academic circles and clinical practice, there is a growing preference for using Boursier's (2013) reliability criteria [2,15,16].
In Boursier and colleagues' article [10], the TS was analyzed over time between trainee and experienced operators: it was observed that there was a difference between the success rates among operators, and there is a tendency to improve with operator training. In that study, operators with more than 100 exams were considered experienced. As shown in Table 2, most exams had a TS greater than 60%, which, according to Castera et al.'s criteria (2005) [6], would be one of the determining criteria for the reliability of the EHT result. What we can conclude about this aspect is that the operator's experience did not determine an influence on the TS, as, regardless of the examiner, most exams showed a TS greater than 60%.
Regarding IQR/Md, several studies point out factors that affect the reliability of the exam. Lucidarme and colleagues [14] proposed that exams with an IQR/Md greater than 0.21 could be a factor of reliability loss and disagreement in the EHT result among operators, possibly overestimating hepatic stiffness. In that study, it was proposed that patients with EHT indicating advanced fibrosis and with an IQR/Md greater than 0.21 should undergo a complementary study with another non-invasive marker. Following this premise, Boursier and colleagues [9] confirmed the importance of IQR/Md for reliability and better accuracy.
As previously indicated, Boursier [9] developed new EHT reliability criteria, based on the principle of the importance of IQR/Md. In his article, he questioned Castera's criteria [6], stating that some exams are excluded but would have reliability criteria. Boursier [17], in his study of inexperienced operators from other areas of medical sciences, compared exams with other more experienced operators and observed, in the end, that with short training, it would already be possible to perform elastography exams reliably enough for clinical practice.
When the variables were evaluated together, using the reliability criteria of Castera, et al. (2005) and Boursier, et al. (2013) [6,9], the proportion of reliable results was similar in both groups (Figures 1- 5).
Transient Elastography of the Liver (EHT) appears to be a highly reliable and accurate method. Even when performed by an operator with limited experience, EHT has proven to be effective. A brief training, with the execution of up to 100 exams, seems to be sufficient to ensure good clinical applicability of EHT, even in the hands of an operator with initial experience in the method.
- European Association for the Study of the Liver. EASL Recommendations on Treatment of Hepatitis C 2018. J Hepatol 2018;69(2):461-511.Available from: https://pubmed.ncbi.nlm.nih.gov/29650333/
- Brasil Ministério da Saúde. Secretaria de Vigilância em Saúde. Departamento de DST, Aids e Hepatites Virais. Protocolo Clínico e Diretrizes Terapêuticas para Hepatite C e Coinfecções/ Ministério da Saúde, Secretaria de Vigilância em Saúde, Departamento de DST, Aids e Hepatites Virais. – Brasília: Ministério da Saúde, 2019.
- European Association for the Study of the Liver. Electronic address: easloffice@easloffice.eu; Clinical Practice Guideline Panel; Chair: EASL Governing Board representative: Panel members: EASL Clinical Practice Guidelines on non-invasive tests for evaluation of liver disease severity and prognosis - 2021 update. J Hepatol. 2021 Sep;75(3):659-689. Available from: https://pubmed.ncbi.nlm.nih.gov/34166721/
- Shen Q, Zhang J, Yang S, Liu L. A comparative study of three ultrasound techniques for liver fibrosis staging. Eur J Gastroenterol Hepatol. 2024 Jun 1;36(6):784-792. Available from: https://pubmed.ncbi.nlm.nih.gov/38526936/
- European Association for the Study of the Liver; Asociación Latinoamericana para el Estudio del Hígado. EASL-ALEH Clinical Practice Guidelines: Non-invasive tests for evaluation of liver disease severity and prognosis. J Hepatol 2015;63(1):237-64. Available from: https://pubmed.ncbi.nlm.nih.gov/25911335/
- Castera L, Vergniol J, Foucher J, Le Bail B, Chanteloup E, et al. Prospective comparison of transient elastography, Fibrotest, APRI, and liver biopsy for the assessment of fibrosis in chronic hepatitis C. Gastroenterology 2005;128(2):343-50.Available from: https://pubmed.ncbi.nlm.nih.gov/15685546/
- Ziol M, Handra-Luca A, Kettaneh A, Christidis C, Mal F, et al. Noninvasive assessment of liver fibrosis by measurement of stiffness in patients with chronic hepatitis C. Hepatology 2005;41(1):48-54.Available from: https://pubmed.ncbi.nlm.nih.gov/15690481/
- Child CG, Turcotte JG. Surgery and portal hypertension. Major Probl Clin Surg 1964;1:1-85.Available from: https://pubmed.ncbi.nlm.nih.gov/4950264/
- Boursier J, Zarski JP, de Ledinghen V, Rousselet MC, Sturn N, et al. Determination of Reliability Criteria for Liver Stiffness Evaluation by Transient Elastography Hepatology 2013;57(3)1182-9. Available from: https://pubmed.ncbi.nlm.nih.gov/22899556/
- Boursier J, Konate A, Guilluy M, Gorea G, Sawadogo A, et al. Learning curve and interobserver reproducibility evaluation of liver stiffness measurement by transient elastography. Eur J Gastroenterol Hepatol 2008;20(7):693-701.Available from: https://pubmed.ncbi.nlm.nih.gov/18679074/
- Perazzo H, Fernandes FF, Soares JC, Fittipaldi J, Cardoso SW, et al. Learning curve and intra/interobserver agreement of transient elastography in chronic hepatitis C patients with or without HIV co-infection. Clin Res Hepatol Gastroenterol 2016;40(1):73-82.Available from: https://pubmed.ncbi.nlm.nih.gov/26056050/
- Castera L, Foucher J, Bernard PH, Carvalho F, Allaix D, et al. Pitfalls of liver stiffness measurement: a 5-year prospective study of 13,369 examinations. Hepatology 2010;51(3):828-35. Available from: https://pubmed.ncbi.nlm.nih.gov/20063276/
- Fraquelli M, Rigamonti C, Casazza G, Conte D, Donato MF, Ronchi G, Colombo M. Reproducibility of transient elastography in the evaluation of liver fibrosis in patients with chronic liver disease. Gut 2007;56(7):968-73.Available from: https://pubmed.ncbi.nlm.nih.gov/17255218/
- Lucidarme D, Foucher J, Le Bail B, Vergniol J, Castera L, et al. Factors of the accuracy of transient elastography (fibroscan) for the diagnosis of liver fibrosis in chronic hepatitis C. Hepatology 2009;49(4):1083-9. Available from: https://pubmed.ncbi.nlm.nih.gov/19140221/
- Anstee QM, Castera L, Loomba R. Impact of non-invasive biomarkers on hepatology practice: Past, present and future. J Hepatol. 2022 Jun;76(6):1362-1378.Available from: https://pubmed.ncbi.nlm.nih.gov/35589256/
- Oeda S, Tanaka K, Oshima A, Matsumoto Y, Sueoka E, Takahashi H. Diagnostic Accuracy of FibroScan and Factors Affecting Measurements. Diagnostics (Basel). 2020 Nov 12;10(11):940. Available from: https://pubmed.ncbi.nlm.nih.gov/33198092/
- Boursier J, Konaté A, Gorea G, Reaud S, Quemener E, et al. Reproducibility of liver stiffness measurement by ultrasonographic elastometry Clin Gastroenterol Hepatol 2008;6(11):1263-9. Available from: https://pubmed.ncbi.nlm.nih.gov/18995217/